Summary :
Using EPIQR+CO2, we assessed the carbon footprint of a low-carbon HPE (High Energy Performance) renovation and a THPE (Very High Energy Performance) renovation. The comparison of total emissions between these two options shows that with a low-impact fuel (0.063 kgCO2/kWh, such as district heating using 80 % of non-fossil fuel energy, for example), the low-carbon HPE renovation is clearly preferable to the heavy THPE renovation.
We also compared the emissions of renovation with demolition followed by new construction, both with a "low carbon impact". The result shows a moderate advantage in favour of renovation, but this advantage is not significant enough to justify a radical position on the issue. Demolition-reconstruction with densification in an area well served by public transport, for example, may prove to be significantly more favourable than renovation in terms of the total carbon footprint of the building and mobility. The article compares the CO2 impact of renovation with densification. The scenario that doubles the built area has a total carbon footprint for building and mobility that is 14 % lower than low-carbon renovation, or 3.8 kgCO2/m2a with an ecological CAD or 4.8 kgCO2/m2a with a standard heat pump or CAD. The advantage of densification is far greater than the CO2 impact of eliminating the old building 0.85 kgCO2/m2a. On the other hand, densification on the outskirts or in the suburbs does not bring this advantage; on the contrary, it increases the carbon footprint by 4.5 - 5.5 kgCO2/m2a
This confirms the relevance of the policy of the cantonal planning departments, which favours the densification of centres that are well served by public transport. The application of the law on low-carbon construction in Geneva will provide a rational framework for determining when it is preferable to demolish or renovate from the point of view of CO2 emissions. A general rule that does not take into account all the determining parameters - such as the impact of the works, direct emissions depending on the fuel used and the rate of use of public transport - could lead to irrational approaches from the point of view of total CO2 emissions. The application of articles 117 and 118 of the Geneva LCI makes it possible to settle this question rationally in terms of the carbon footprint.
Introduction
I heard about this radical idea for promoting the circular economy with great interest. Renovation effectively recovers the essentials of a building: its structure and some of its interior fittings and fixtures that are not yet too outdated or obsolete. The aim of this approach is to reduce the carbon footprint of construction, cut waste and limit the consumption of non-renewable resources.
I wanted to quantify the benefits of this proposal in concrete terms. Now that a carbon assessment of a renovation using EPIQR+CO2 only requires a few hours' work, as an experienced user, it didn't take me long to check two renovation scenarios for a typical Geneva building.
The results of Lund, A. I. et al, in "Whole Life Carbon Assessment of Renovation" from the University of Aalborg, show that the average carbon footprint of 29 renovated buildings is around 7 kgCO2/m²/year. These results are very consistent with an analysis we carried out on the renovation scenarios of 20 CPEG buildings using EPIQR+CO2 as part of the E-DYCE project: the median CO2 emissions of a standard THPE renovation in the initial phase of the project (CECB+) is 5.8 kgCO2/m²/year. It is well known that, during the development of the project, additional work is often added, and it is very likely that the actual footprint at the end of the work will be close to the Danish results.

Figure 1: Indirect emissions calculated with EPIQR+CO2 for the THPE scenarios proposed by CECB+ for 20 buildings in the E-DYCE project, according to the five LCI work packages (foundation, structure, envelope, interior fittings and installations). The limit value of SIA 2040 and the future standard 390 for renovation is set at 5 kgCO2/m²/year. The majority of these buildings require optimisation to reduce their carbon footprint to below 5 kgCO2/m²/year.
Rebuilding the same surface area in compliance with the limit value that is emerging in the future SIA 390 standard would "cost" a maximum of 9 kgCO2/m²/year. These values (5 and 9 kgCO2/m²/year) will probably be included in the implementing regulations for the new articles 117 and 118 of the Geneva LCI on low-carbon construction and renovation. Renovation therefore has a significant carbon cost compared with new construction. It is not free: although it mobilises other resources than new construction, the footprint per m² remains quantitatively significant, especially with the current practice of renovation, where the aim is to "make as good as new".
It should also be remembered that direct emissions after a renovation are around 50 % higher than those for a new build. This is a reality specific to renovation and is recognised both in the SIA 380 limit value for heating requirements and in MOPEC 2016.
Average direct heat-related emissions from the 12,000 existing residential buildings in Geneva, representing the entire cantonal building stock, will amount to around 29 kgCO2/m²/year in 2023. According to the canton's climate plan, these emissions need to be reduced by 60 % compared with their 1990 level (~15 kgCO2/m²/year), and to reach 6 kgCO2/m²/year to achieve carbon neutrality by 2050. To go from 29 to 6 kgCO2/m²/year, which is the indicative value of SIA 390, the work currently costs 7 kgCO2/m²/year according to current practice, and 5 kgCO2/m²/year as part of a low-carbon footprint renovation. Investing 5 to 7 kgCO2 to save 21 kgCO2 gives an average CO2 performance coefficient of 3 to 4.
What's more, the CO2 emitted by the renovation work will be emitted immediately, whereas it will take 60 years to recover all the CO2 saved. It is unlikely that the members of parliament, when they decided to reduce CO2 emissions by 60 %, envisaged that this would cost in advance 25 to 33 % of the emissions saved by the work. The new provisions of the Geneva LCI go some way to correcting this unanticipated increase.
Reference building for renovation and method
The real building is in Bernex, but I'm going to test two hypotheses about its location. In the "periphery" hypothesis, the building is actually in Bernex. In the "city centre" hypothesis, I'm going to assume that the building is located in Jonction, Pâquis, Route de Lyon or Eaux-Vives. This is the reference building used to analyse the consequences of articles 117 and 118 of the LCI - GE. The building has an energy reference area (ERA) of 2035 m² and comprises 24 flats. According to the surface areas allocated in the SIA 390 standard for a collective building, it would house 45 people, which corresponds more or less to the number of people currently accommodated.

Figure 2. Reference building for the study.
According to EPIQR+CO2, a sober HPE renovation costs 5.1 kgCO2/m²/year to reduce the building's ECI (Energy Consumption Index) to 230 MJ/m²/year, in line with SIG AMOen's best practice in terms of actual consumption after renovation. Despite all the optimisations and a sober approach, which leaves the dwellings untouched and preserves the sanitary facilities and kitchens from the 1980s, and despite a very simple technique, the renovation is struggling to comply with the SIA 390 limit value.
A THPE renovation with a complete refurbishment of the building, including the dwellings and their interior fittings dating back more than 35 years (the standard lifespan according to SIA 2032 being 30 years), would cost 8.5 kgCO2/m²/year in indirect emissions for the works, to reduce the IDC to 137 MJ/m²/year, or 2.6 kgCO2/m²/year for heat and electricity, thanks also to solar electricity self-sufficiency of around 50 %.
The latest edition of EPIQR+CO2 makes it possible to draw up a balance sheet of indirect emissions, and the new report, which summarises costs and emissions, shows that the "complete THPE renovation" scenario costs CHF 7 million, with 8.5 kgCO2/m²/year of indirect emissions and 2.6 kgCO2/m²/year of direct emissions, giving a total of 11.1 kgCO2/m²/year. This sum also barely meets the SIA 390 limit.
The low-energy HPE scenario, which costs CHF 5.6 million, shows indirect emissions of 5.1 kgCO2/m²/year and direct emissions of 4.7 kgCO2/m²/year, for a total of 9.8 kgCO2/m²/year. We can see that the financial savings are in line with the green and circular economy: with savings of CHF 2.4 million, we also save 1.2 kgCO2/m²/year, or 147,000 tonnes of CO2 over a 60-year lifespan after renovation.
The big question is: "What is the residual lifespan of the preserved kitchens and bathrooms? In any case, they will not be affected for the next 15 to 20 years.


Figure 3: At the top of the list is one of the new EPIQR+CO2 outputs, which displays the CO2 impact of each group of elements for the two scenarios we have created. At the bottom we have created a histogram with the impacts according to the LCI batches, and on the graph with the guideline values per batch we have marked the impact of each scenario with a triangle of its colour.
Analysis of the impact of each lot (presented above in a graph with indicative reference values) shows that, in both scenarios, the envelope exceeds the guideline values. This is due to the replacement of the windows with triple-glazed wood-metal models, as well as the considerable thickness of the insulation, particularly in the THPE scenario. In the case of the complete renovation, the impact of the interior fittings also contributes to this situation.
For complete THPE renovation, installations (solar thermal, solar photovoltaic, double-flow ventilation) also have a major impact. The new version of EPIQR+CO2 automatically generates a summary including costs as well as direct and indirect emissions.

Figure 4: Summary output of EPIQR+ scenarios. As with costs, EPIQR+CO2 provides transparent results for the CO2 emissions of the work. Analysis of these indicators enables users to optimise the carbon impact of renovation scenarios.
Demolition and reconstruction
How are we now going to compare a renovation scenario with a "demolition - reconstruction" scenario? Particularly if the reconstruction takes advantage of a reserve of unused building rights with a density of 150 or 200%! We carried out an ecobalance of the new building that would be constructed in place of the existing one. As a new building, we defined a reference building by simplifying a newly constructed low carbon impact building.

Figure 5. The new reference building, with a surface area of 4188 m2 and a carbon footprint of 8.2 kgCO2/m2a indirect emissions, and 3.2 kgCO2/m2a direct emissions
The new building features a low-carbon, prefabricated concrete facade, optimised concrete slabs, sober interior fittings and fixtures, and a single basement level. R+5 building with an SRE of 4188 m2 it offers a densification of 200 % and would accommodate 45 more people. Direct emissions from the new building, built to the new HPE energy standard, are 3.2 kgCO2/m2a and indirect emissions of 8.2 kgCO2/m2a according to the ecobalance carried out using LesoSai software. The total footprint of the new building is 11.5 kgCO2/m2a higher level for both the HPE and THPE renovation scenarios.
For comparison, we have included in the graph below other alternative scenarios with densification rates of 0 and another of 150%. The only scenario that could be better than a low-energy HPE renovation without densification is the case of a new building that achieves the target values of SIA 390 (7 kgCO2/m2/a and 2 kgCO2/m2/a). We have also included in the comparison a so-called "standard" reconstruction for which we have taken as direct emissions the MOPEC 2016 and indirect emissions based on a value of 13 kgCO2/m2/a.

Figure 6. Indirect and direct emissions of different renovation or reconstruction options. With the exception of reconstruction in accordance with the SIA 390 target value, all the other options emit more CO2 than the low-energy HPE renovation chosen for the project.
Whatever the configuration, renovation generally has a lower carbon impact than new construction, except in the case of a building that reaches the target value.
We now have all the information we need to compare renovation with demolition and reconstruction, taking into account different levels of densification. For reconstruction with double the current surface area, the carbon footprint is 8.2 kgCO2/m²/year.
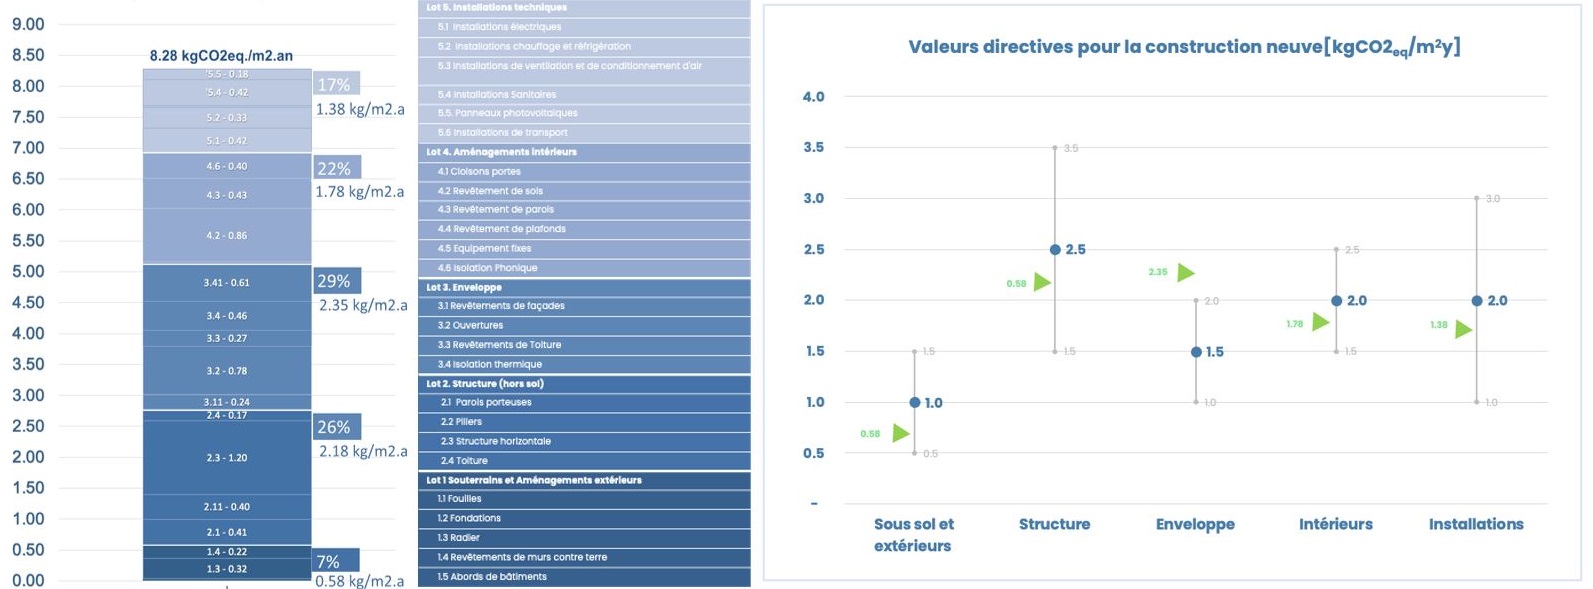
Figure 7. Indirect emissions calculated with LesoSai and adaptation of emissions according to the number of storeys (building form factor from 1 to 1.3)
Densification in the centre and densification on the outskirts of the canton.
Let's now assume that the building is located in the city centre with a densification potential of 150% and 200% of the current surface area. In the case of densification at 150%, 23 more people will live in the city centre, and in the second case 45 more people. Issue 59 of the Canton of Geneva's statistical communications gives us the average kilometres travelled by the people of Geneva according to where they live. Using SIA 2039, we can translate these distances into kgCO2 per person. This gives us 631 kgCO2/year for people living in the city of Geneva and 1047 kgCO2/year for people living in the outer suburbs. We assume that the "average" person living on the outskirts of the city is somewhere between the suburbs and the inner suburbs.

Figure 8: Distance travelled by car by place of residence and equivalent CO2 emissions calculated using SIA 2039 as a function of distance and mode of transport.
According to our assumptions, the densification of the city centre will result in a saving of 416 kgCO2/a per person moving from the "periphery" to the centre.

Figure 8: Comparison of a low-carbon HPE renovation scenario with demolition and reconstruction with varying degrees of densification.
As the first two scenarios in the graph above show, from the point of view of CO2 emissions, there is no point in demolishing and rebuilding the same surface area. Nevertheless, the very similar values of the two options tend to call into question the radical nature of the proposal for a moratorium, or for opposition to demolition "on principle".
The other impacts of demolition must also be weighed in the balance, such as the quality of life and comfort of residents, architectural quality, the type of waste that will be generated and its treatment, and compliance with housing standards.
The situation is different for densification. The two densification options in the centre, the first with 1,000 m2 more than the existing building (+23 people) and the second with 2,000 m2 more (+45 people) are clearly more favourable than renovation in terms of the total emissions produced by the construction and operation of the buildings and by the mobility of people. The 200% densification even came out with 14% less overall emissions, i.e. 3.8 kgCO2/m2/a. According to our calculation assumptions, we have taken an energy vector that is very favourable to reducing direct emissions in the scenario of, i.e. an ECO CAD with 80% of heat from waste incineration (CO2 factor 0.063 kgCO2/kWh). If we compare the results with another energy vector, such as a heat pump or standard CAD, at 0.16 kgCO2 per kWh, the advantage of densification is even more marked, with a gap widening to 4.8 kgCO2/m2.a difference from the renovation scenario.
There is still one aspect not discussed in our analysis: how are demolition emissions taken into account? Admittedly, the SIA 2032 standard includes emissions linked to disposal in the scope. But they only concern the elimination of elements of the building to be constructed, which are already taken into account in advance, as is the elimination of materials used for renovation. Emissions linked to the disposal of the old building "belong" to the old building, they are a thing of the past. But what we receive from the past is a legacy. In the event of demolition, this legacy is lost. To assess the CO2 impact of demolishing the old building, we carried out a carbon balance as it was actually built in the 60s with LesoSai.

Figure 9. Indirect footprint of the old building as it was built in the 1960s according to a carbon balance with LesoSai. Emissions for disposal are 0.86 out of 7.8 kgCO2/m2a.
Total emissions linked to the construction of the existing building are relatively low due to the extreme economy of means of this 1960s building (load-bearing breeze-block walls and no thermal insulation). Emissions linked to the end of the building's life are estimated at 0.86 kgCO2/m².an.
The benefit of densification, estimated at between 3.8 and 4.8 kgCO2/m².year, is much greater than the 0.86 kgCO2/m².year of demolition and disposal of the existing building. Even if this densification is added to the emissions of the new building, outside the normative perimeter, the conclusions do not change.
Demolition to increase density on the periphery shows the opposite results in the graph in figure 8. Its impact is always much greater than that of all the renovation options.
Our answer to the question: should there be a moratorium on demolition? As far as the carbon emissions criterion is concerned, the answer is "it depends where", in particular the location, quality and density of the original building. The framework for the application of articles 117 and 118 of the Geneva LCI provides all the elements needed to decide this question on a case-by-case basis, as far as the carbon footprint is concerned.
Conclusions.
The results of the carbon footprints show that a sober renovation, aiming for HPE energy performance, compares favourably with an overall carbon footprint that is lower than a major renovation to THPE standard. The impact of thicker insulation, renewable energy installations and comprehensive renovation of the building, including the interior fittings of the dwellings, reduces the carbon footprint of the work, and the savings on direct emissions cannot compensate for this. The carbon emissions of the buildings in the demolition-reconstruction scenarios for the same surface area show results similar to those for renovation. Nevertheless, densification in the city centre significantly reduces the overall carbon footprint, including mobility. Densification of 200 % with low carbon impact construction, according to the LCI, offers an advantage of 14 % on total emissions, i.e. between 3.8 and 4.8 kgCO2/m².an depending on the energy vector. This benefit is significantly greater than the 0.86 kgCO2/m².year associated with the disposal of the old building.
Articles 117 and 118 of the Geneva LCI provide an analytical framework for deciding the "demolish or renovate" question on the basis of rational arguments. There is no "answer in principle". A number of parameters need to be taken into account to give a rational answer to this question: the CO2 impact of the works and the constructive quality of the existing building, the level of decarbonisation of the energy vector and the energy performance after the works, the possible densification in relation to the original building and the CO2 impact of the mobility induced by the new inhabitants. If we were to carry out the same study without the presence of a DAC with 80 % incineration waste, the conclusions would remain the same, but with an increased advantage for densification. It goes without saying that densification on the periphery is disadvantageous compared to renovation in all cases.